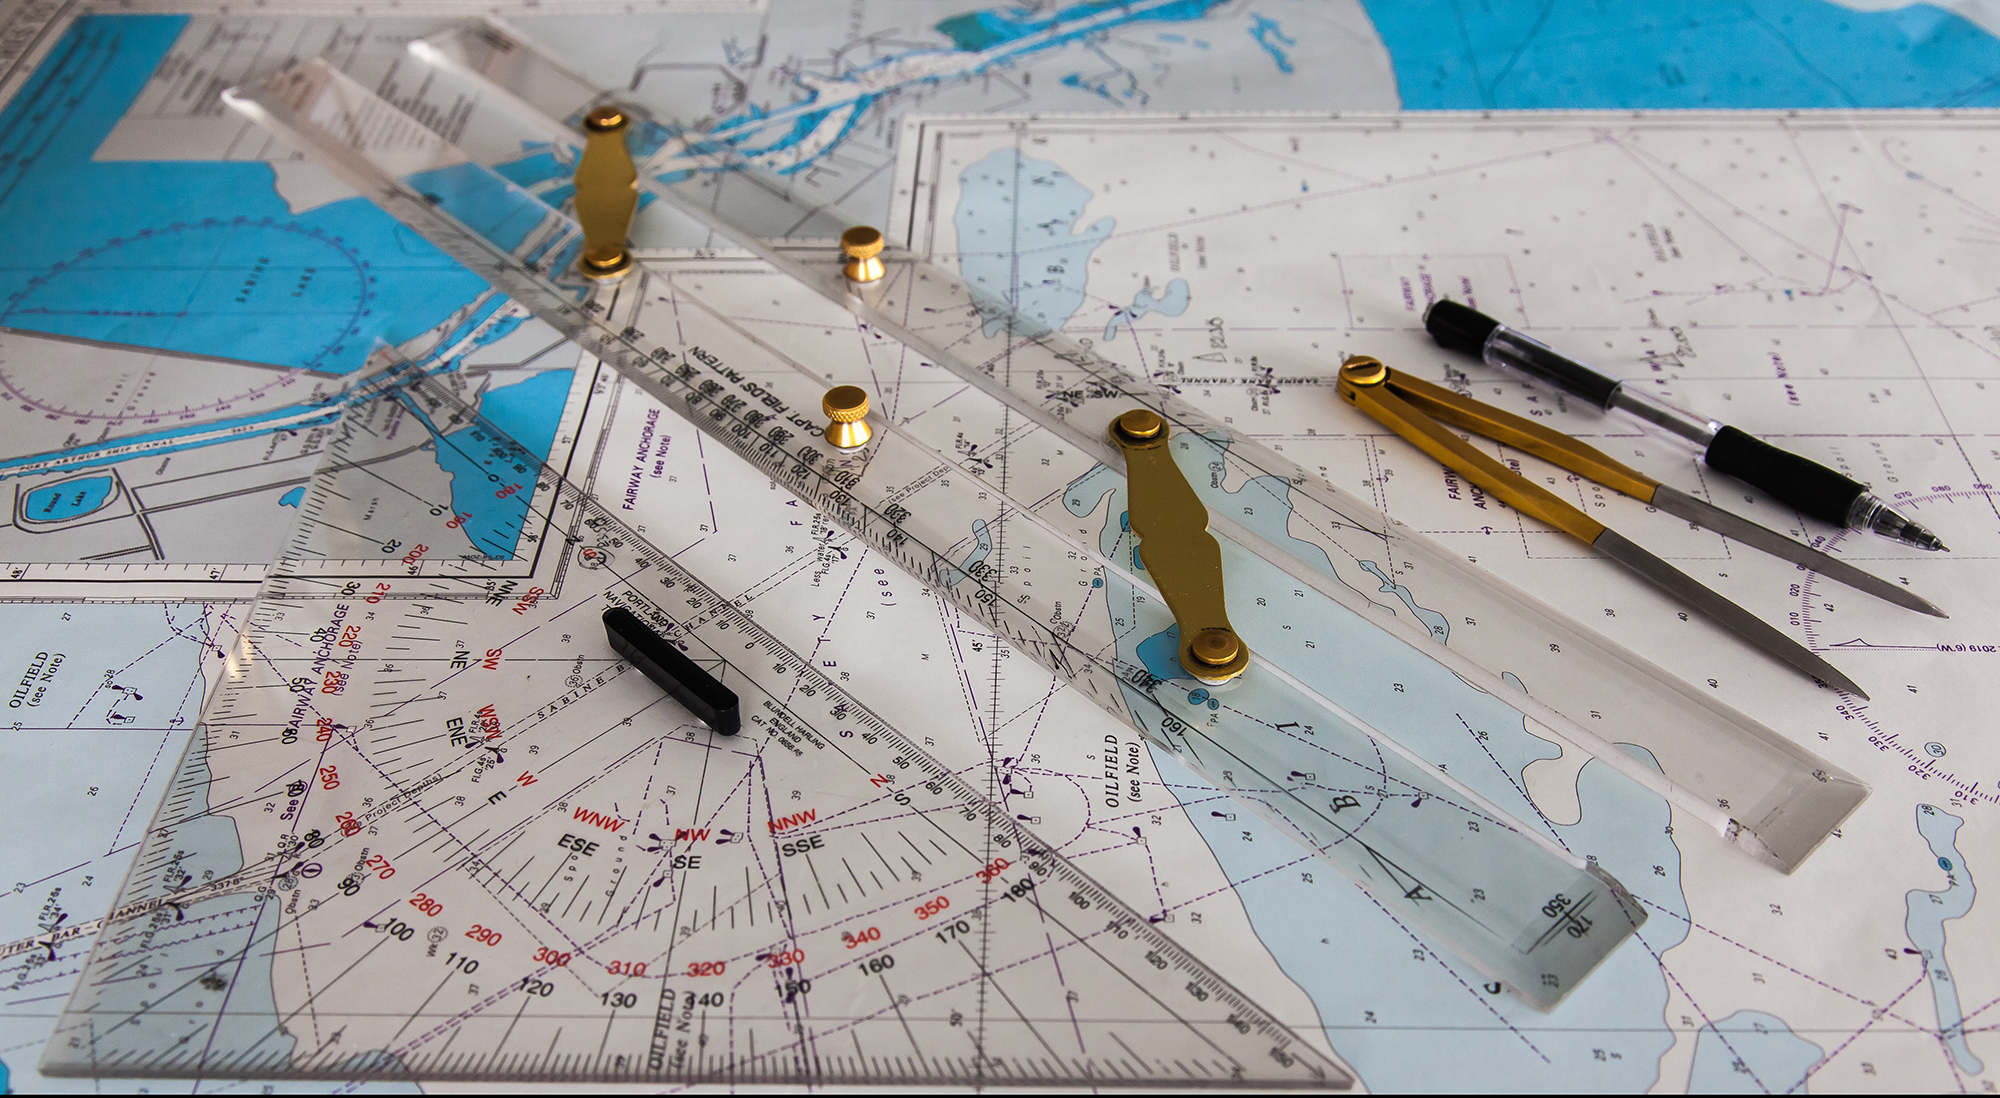
I vividly remember one winter night when I was 7 or 8 years old, sitting at the dining room table with my grandfather and a salt-stained chart spread before us. With dividers, parallel rules, a pencil and imagination, we plotted a course around the North Atlantic.
Listening to seven decades of sailing stories, I imagined myself cruising far and wide as my pencil traced ports and islands, foreign and familiar. In the years since, as I have plotted my own real courses, the nautical chart became more than a navigational tool. It is a symbol of the places we have been, and the places we wish to visit.

I grew up on Casco Bay in Maine, and my waterproof chart was my best friend. In sailing school, it lived stuffed into my lifejacket; as new instructors came and went from summer to summer, I smugly sailed my dinghies exactly where I knew the threat of reefs would cause alarm, but where I would be just fine.
Later, in high school, that beat-up sheet of vinyl was the third mate aboard the lobster boat where I worked as a sternman. The skipper wasn’t too keen on writing anything down, but at the beginning of each season, he was pretty glad to see where I had marked last year’s good and bad hauling. Reading that old chart today brings back fond memories of summertime expeditions to Lumbo’s Hole, the Jewell Island ruins, and the Bailey Island Bridge.
In 2019, the National Oceanic and Atmospheric Administration announced that by 2025, it would retire without replacement its entire catalog of paper and raster charts. The notice cited the increasing prevalence of electronic navigational charts on vessel bridges and chart tables, as well as the benefits of continuously updated data available for digital products.

What the notice did not cite, however, was the momentous nature of this transition between something carried by mariners for eight centuries, and a tool only approved for statutory carriage in 2016.
As of December 2024, the last of NOAA’s paper charts have been canceled. They are no longer produced or updated, and they no longer satisfy U.S. Coast Guard requirements for the carriage of charts.
It’s the end of an era.
American Chartmaking
American nautical charts have a history that reflects two centuries of scientific and technological advancements.
In February 1807, Congress passed an act appropriating $50,000 for the survey of the coasts of the United States, thus establishing the rudimentary Survey of the Coast, later renamed the U.S. Coast Survey. The act directed the president to “cause proper and intelligent persons to be employed” in public vessels, laying the groundwork for an agency dedicated to providing mariners with the best information available. In 1835, the Survey produced its first chart, depicting the entrance to the harbor of Bridgeport, Connecticut.
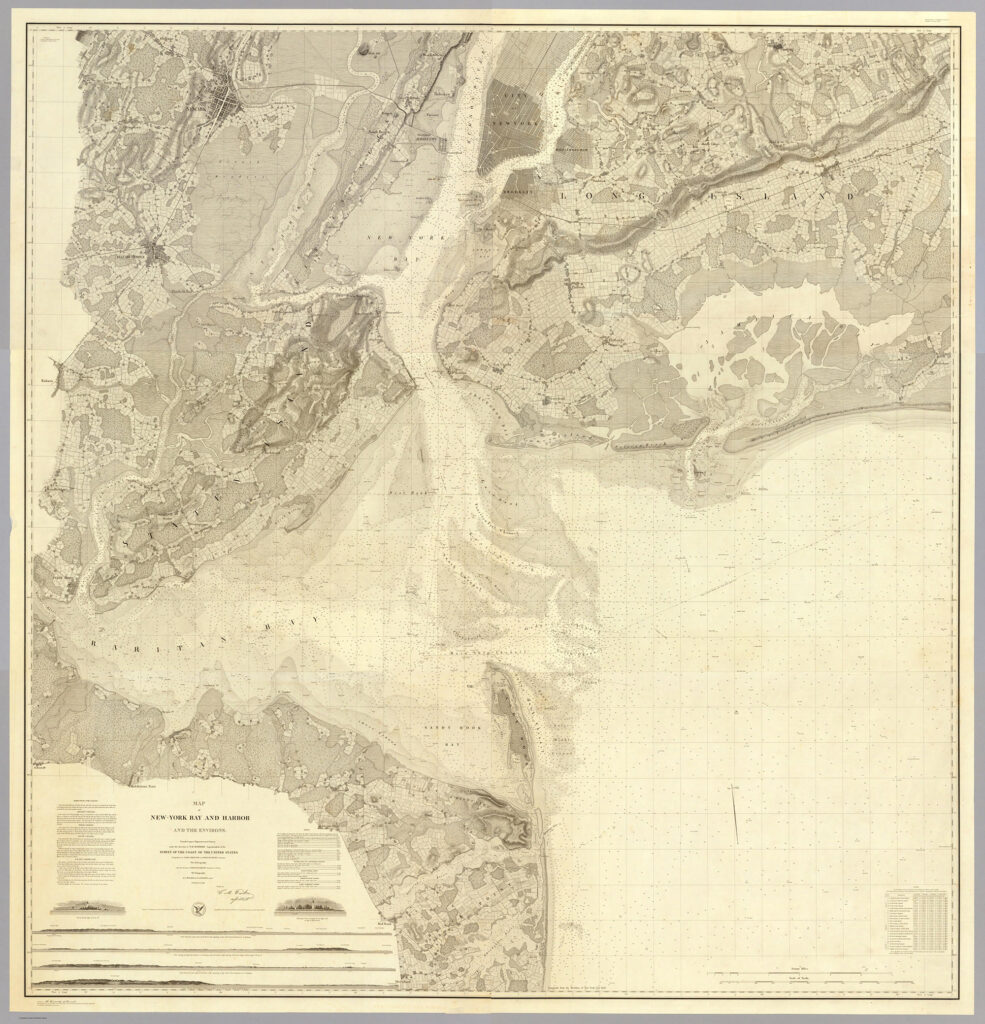
In 1844, the Survey published its first engraved chart. While surveying for this chart of New York Harbor, the survey vessel Washington apprehended the slave ship Amistad, soon the subject of a landmark court case in which the Washington’s officers sued for salvage rights over the enslaved people aboard.

The inclusion of soundings, coastal landmarks and bottom characteristics on early charts allowed the mariner to use multiple techniques to fix a position. Likewise, these charts provided latitude and longitude coordinates, which not only locate the chart’s contents within the broader ocean geography, but also enable the seagoing mariner to plot a position with celestial navigation, in conjunction with other navigational techniques.
By the 1930s, new technologies rapidly increased chart accuracy. Aerial photography could be used to form a three-dimensional model of terrain. The advent of shipboard sonar allowed a survey vessel to steam nonstop while collecting accurate bottom data. Likewise, a navigator aboard a vessel equipped with sonar could compare sonar readings with those portrayed on a chart, and thus obtain a fix.
Another interwar innovation, radionavigation, used signals from shore-based radio beacons to help mariners fix their positions. The most prominent radionavigation system was the long-range radionavigation system, or Loran. Chart features from these new technologies could be easily printed in multiple colors thanks to the new technique of photolithography.
Adopting Digital Tech
The development of GPS in the early 1980s marked a fundamental turning point in the history of marine cartography and navigation. GPS radically reduced the cost of precise surveying, and came to dominate position, navigation and timing by the beginning of the 21st century.
Older navigation techniques were rendered obsolete. Celestial navigation, although still taught to most aspiring naval and merchant marine officers, is considered archaic. And Loran, the mainstay of 20th-century marine and aerial navigation, was shut down in 2010.
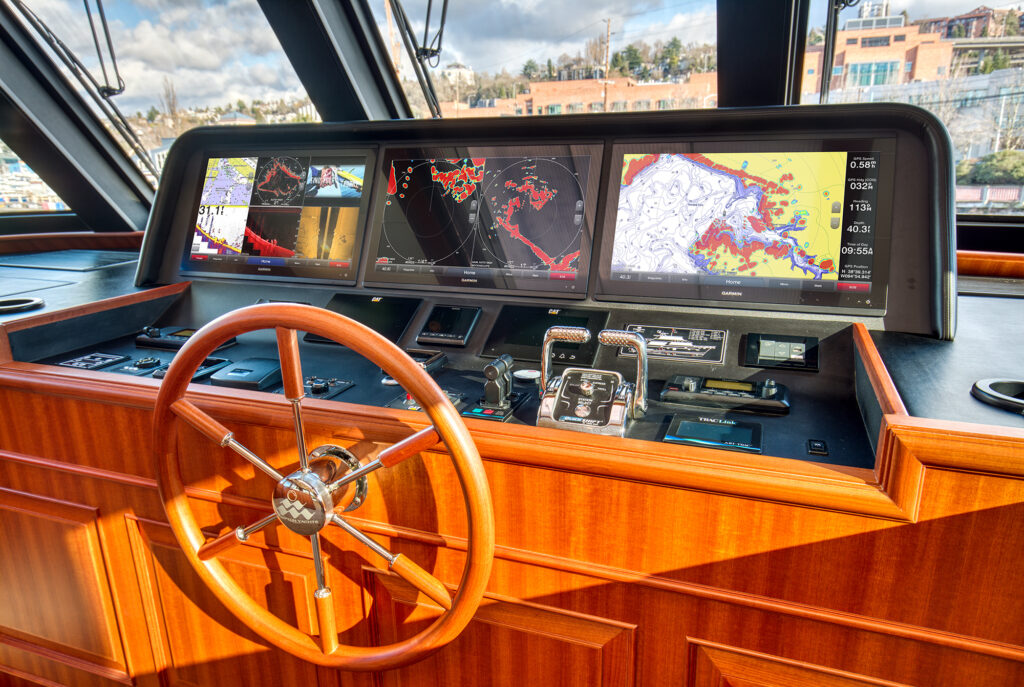
NOAA’s Electronic Navigational Chart suite has become its premier product since its debut in the 1990s. The agency began digitally scanning its paper chart products in the late 1980s, forming what would become the basis of the new ENCs. Since 2000, the demand for NOAA print charts has declined by more than half.
In 2014, international SOLAS regulations were amended to require most seagoing commercial vessels to carry ENCs. Just as previous generations of paper charts could be used for navigation by sonar, Loran, celestial fixes, landmark-based piloting and line-and-sinker sounding, ENCs can be overlaid with data from AIS, radar, sonar and GPS. The U.S. Coast Guard authorized the use of electronic products to satisfy chart carriage requirements in 2016.
Just as photolithography overtook copper-plate engraving in the late 19th century, electronic charts presented a strong alternative to the previous paradigm.
NOAA’s Sunset of Paper Charts
In 2019, NOAA announced that paper charts were to be phased out by 2025. The transition is now complete: Paper charts no longer satisfy Coast Guard or SOLAS carriage requirements. All canceled charts have been added to the digital catalog of the Historic Map & Chart Collection.
NOAA may be the first hydrographic office to cancel its entire suite of traditional paper nautical charts, but it is unlikely to be the last. Doing so has enabled NOAA to create higher-quality, larger-scale, electronic navigational chart coverage of U.S. waters. Advances in equipment and software have made use of ENCs accessible to large and small commercial vessel operators, recreational boaters and other non-navigational data users.
The total transition to ENCs has facilitated greater integration with international standards, superior ENC production, vastly reduced costs and integrated Notice to Mariners updates. One aspect of the transition is that the Office of Coast Survey is redrawing the boundaries of its ENCs to form a regular grid pattern, rather than following the layout of the paper charts they are replacing. The adoption of a grid system not only significantly increases the ease and efficiency of chart production by NOAA and selection by the mariner, but also enhances greater integration with international charts.
A problem has arisen when the NOAA maps are printed out for use. Outfits like Maptech that produce spiral-bound chart books have noted that when printing out a NOAA custom chart, some information can be lost or displayed incorrectly. NOAA is aware of the problem and working on a solution (this is obviated when using multifunction displays, where you can zoom in and see details).
NOAA ENCs are free for mariners to download, unlike paper charts that could cost up to $30 each, a great expense if a boater regularly replaced a suite of charts covering a large area. This change enables mariners to update their charts regularly and affordably, satisfying carriage charts in a way that many chart rooms failed to do, as they relied on outdated paper charts to save time and costs.
And so, after hundreds of years of service, the nautical chart as we know it has passed. From medieval portolans to multilayered electronic displays, the nautical chart has always been a reflection of its era’s scientific, technological and commercial priorities. For generations of mariners, the paper chart was a trusted companion, bearing witness to countless voyages planned, plotted and sailed. In the cold of winter, a chart spread on the dining-room table could spark wonder and a sense of adventure. Whether piled high in an attic corner, stowed diligently in a drawer, or framed on a wall, a paper chart was a thing of beauty: elegant shades of green, blue and tan showed our favorite places and those we hoped to explore anew.
This article originally appeared in the July/August 2025 issue of Passagemaker magazine.